PHP simple monitoring
Gain full visibility into your PHP runtime. Monitor memory usage and execution metrics in real-time to ensure your scripts are running at peak efficiency.
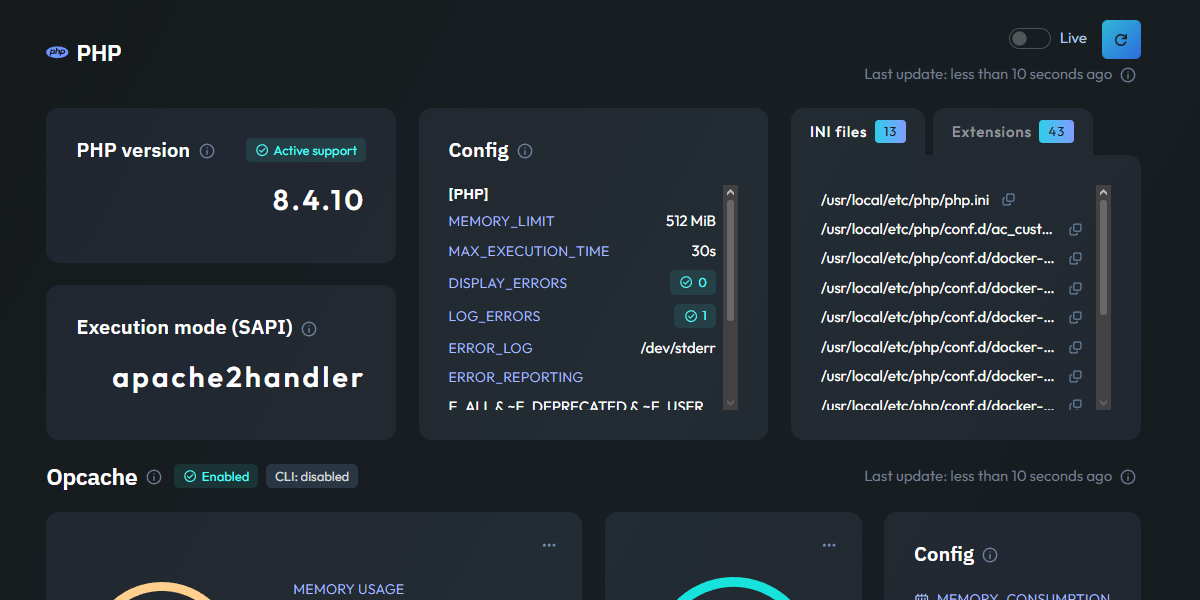
Essential PHP metrics
Opcache Efficiency
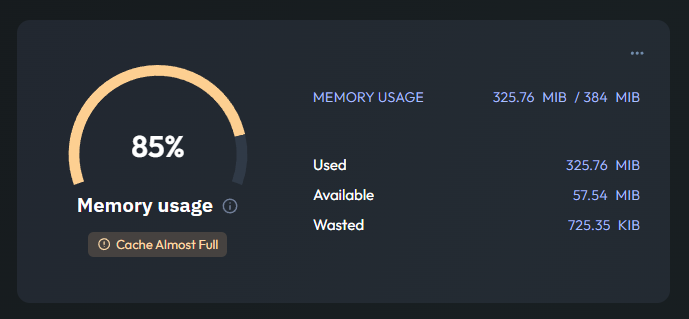
This gauge shows your Opcache Memory Usage, allowing you to see how much RAM is dedicated to storing precompiled script bytecode. Keeping an eye on this prevents PHP from recompiling scripts on every request, which is vital for high performance.
The dashboard also tracks your Opcache Hit Rate. A high hit rate ensures that your server is serving scripts directly from memory, significantly reducing CPU load and improving response times for your users.
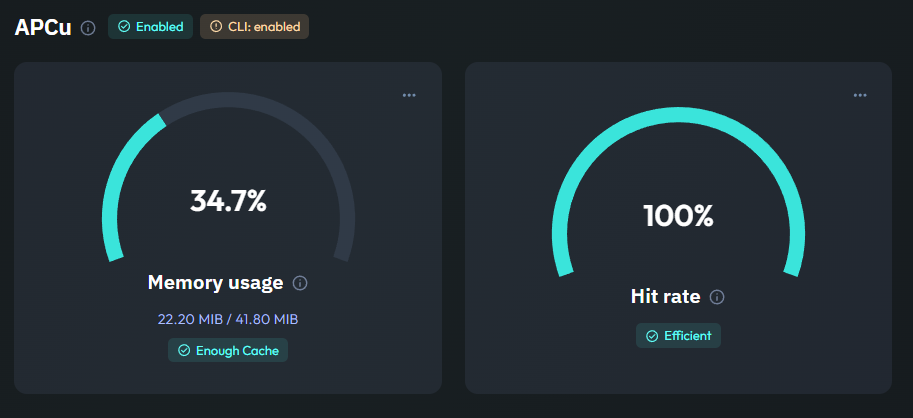
APCu Performance
If your application uses APCu for data caching, these gauges for Memory Usage and Hit Rate are essential. They tell you exactly how much application-level data is being cached and how often that data is successfully retrieved without hitting the database or filesystem.
Monitoring these metrics helps you fine-tune your caching strategy. If the hit rate is low or memory is full, you can quickly identify the need for optimization before it affects your application's speed.
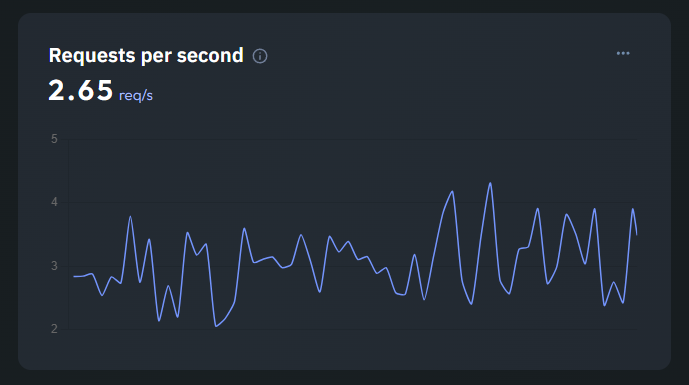
PHP-FPM Throughput
Visualize the real-time load on your PHP interpreter with the Requests per Second chart. This metric tracks how many PHP requests are being processed by PHP-FPM, giving you a clear view of your application's activity levels.
Beyond just throughput, Jmonitor collects numerous other PHP-FPM metrics, such as active processes and slow requests. This deep visibility ensures you can detect and resolve execution bottlenecks before they turn into performance issues.