Nginx simple monitoring
Keep your web traffic flowing smoothly. Monitor your Nginx server's real-time health and ensure your connection handling is optimized for peak performance.
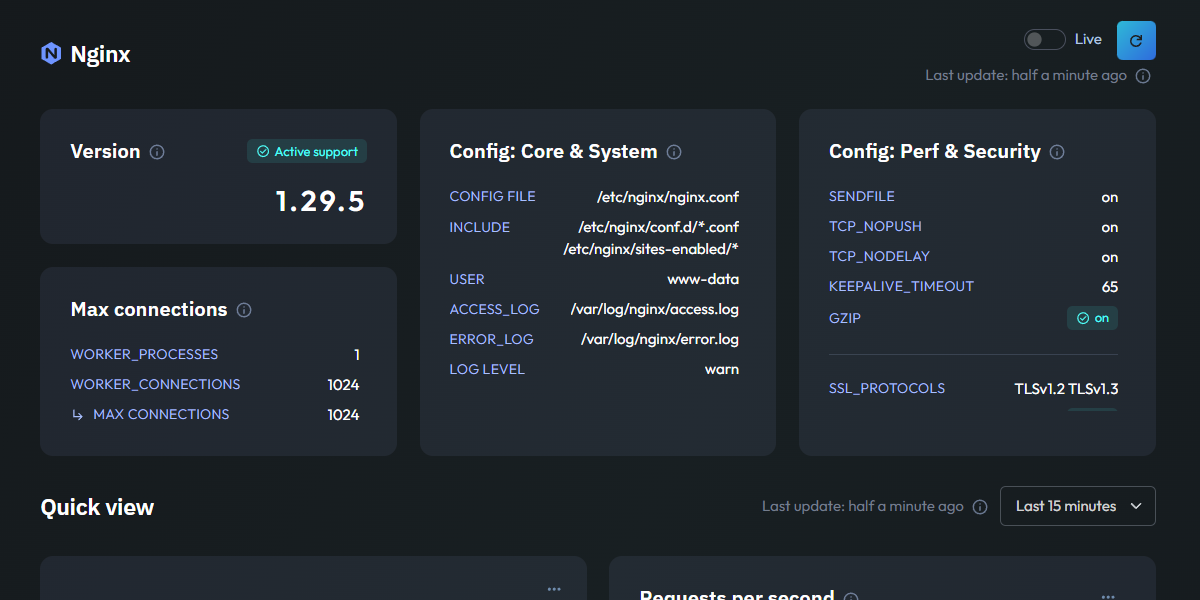
Essential Nginx metrics
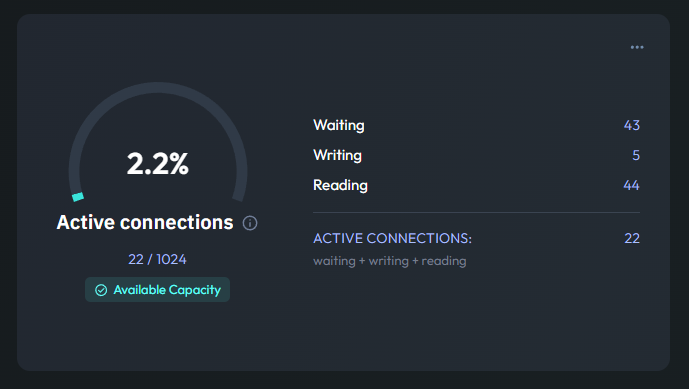
Active Connection Breakdown
This gauge gives you a complete overview of your Active Connections. It breaks down your traffic into Reading, Writing, and Waiting states, so you can see exactly how Nginx is interacting with your users at any given moment.
Understanding these states is key to identifying bottlenecks. For instance, a high number of waiting connections might suggest that your backend is slow, while a spike in writing shows heavy data delivery to your clients.
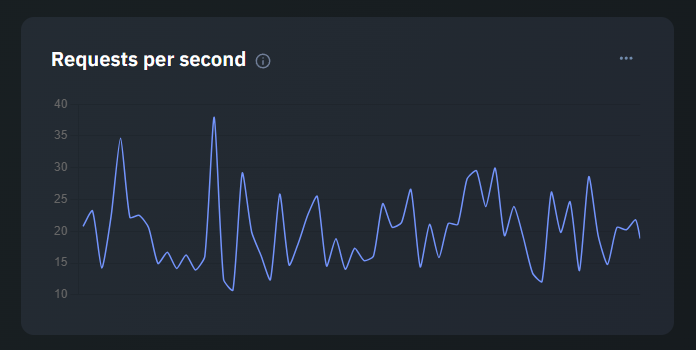
Requests per Second
Follow the pulse of your web server with a real-time line chart of Requests per Second. This metric is the most direct way to measure the load on your infrastructure and visualize traffic spikes as they happen.
By seeing the exact volume of requests processed, you can easily correlate traffic growth with server performance, helping you make informed decisions about scaling your resources.
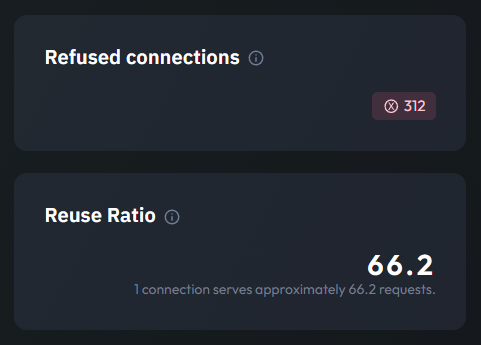
Connection Health & Reuse
Performance isn't just about speed; it's about efficiency. Jmonitor tracks Refused Connections to alert you immediately if your server is dropping traffic, and monitors the Reuse Ratio to show how effectively your "Keep-Alive" settings are working.
A high reuse ratio means your server is saving resources by recycling existing connections instead of creating new ones for every request. Monitoring these stats ensures your Nginx configuration is perfectly tuned for a fast and reliable user experience.