MySQL simple monitoring
Ensure your database remains fast and accessible. Visualize your MySQL or MariaDB health in real-time with clear indicators of connection usage, slow queries, and memory efficiency.
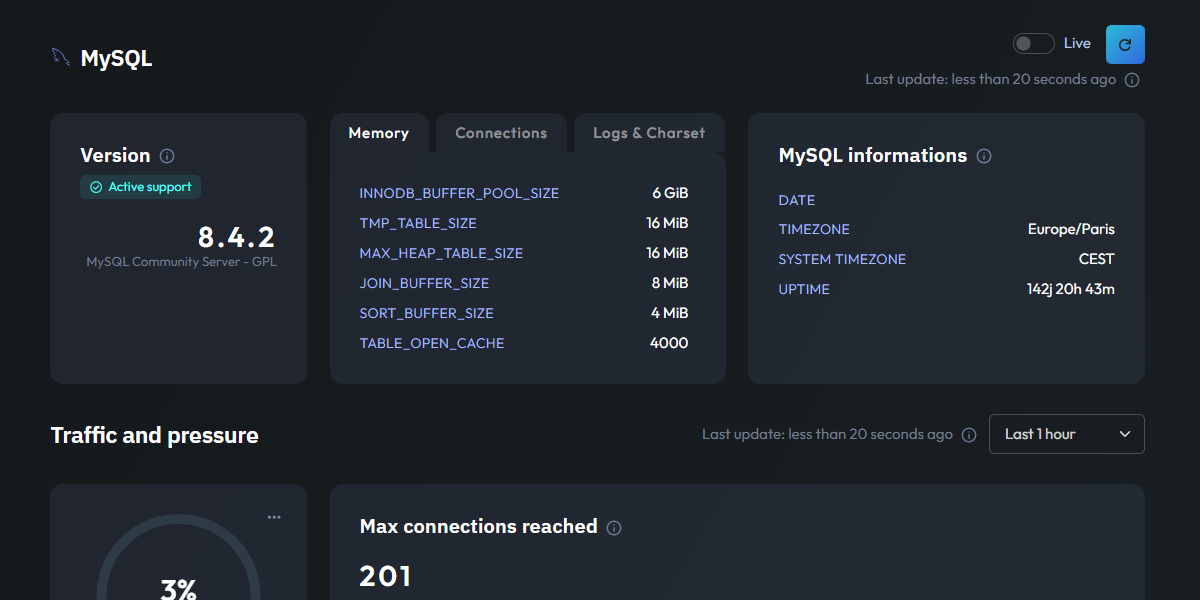
Essential MySQL metrics
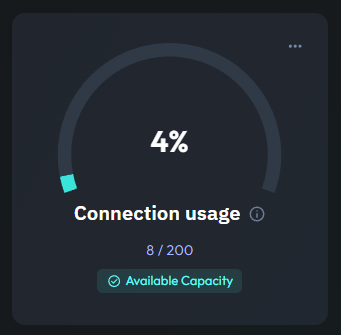
Connection Availability
This gauge provides an instant view of your Connection Usage, showing how many clients are currently connected to your database. It is the first line of defense against "Too many connections" errors that can take your application offline.
The dashboard also tracks if you have ever reached your maximum connections limit. This allows you to proactively adjust your settings before your users experience any service interruptions.
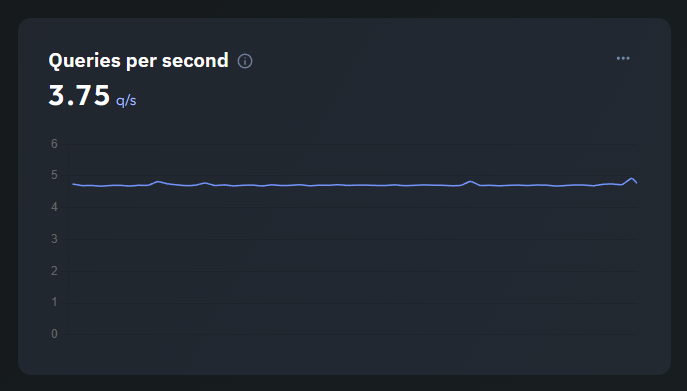
Queries per Second
Visualize the workload of your database with a real-time line chart of Queries per Second (QPS). This metric helps you understand the traffic volume your database is handling and identify peak periods of activity.
Monitoring throughput is essential for scaling your infrastructure. By seeing how QPS correlates with application performance, you can better plan for growth and optimize your resource allocation.
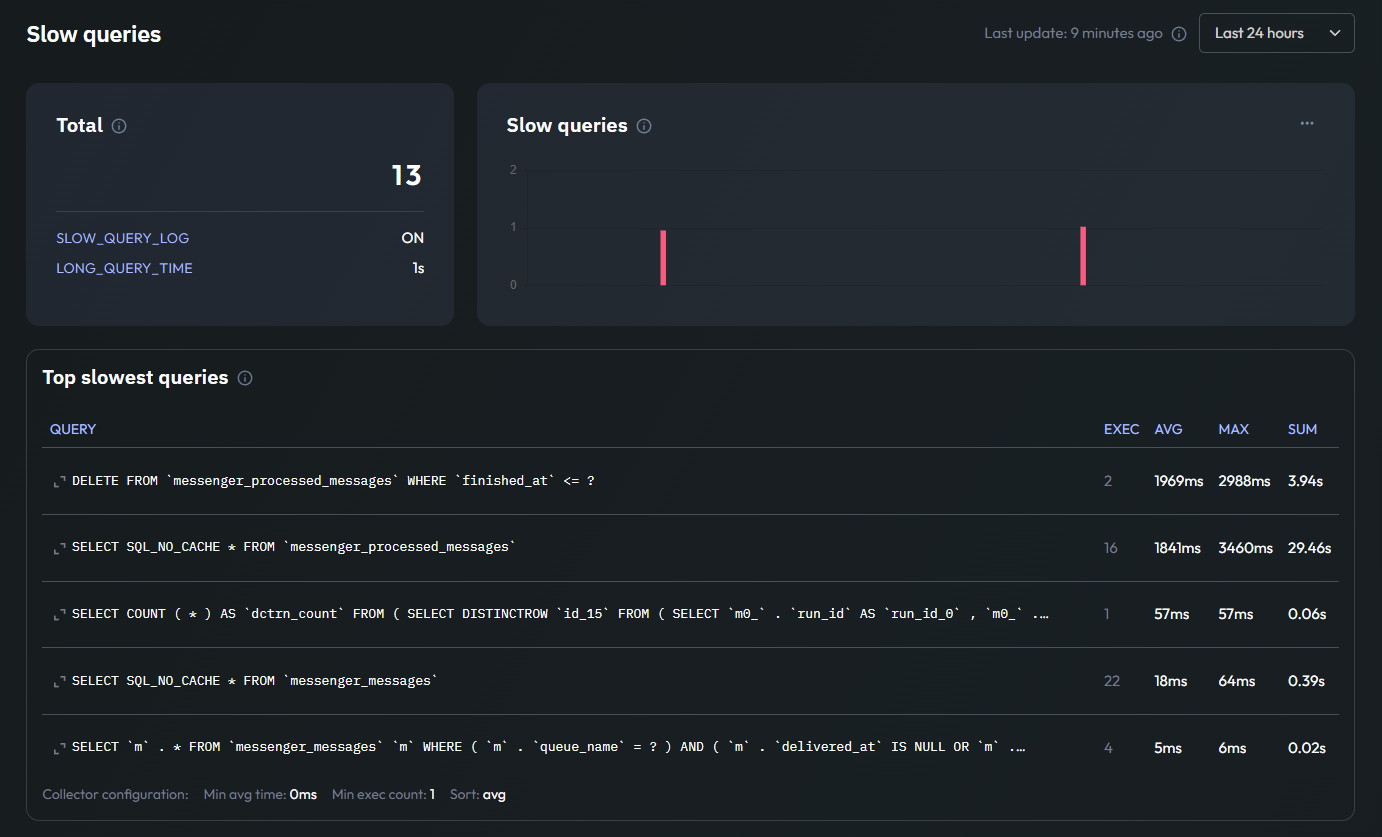
Slow Query Analysis
Performance issues often hide in unoptimized SQL. Jmonitor highlights Slow Queries through a clear bar chart and a list of the Top Slowest Queries, making it easy to see which requests are dragging down your application's speed.
Instead of parsing through massive log files, you get a prioritized view of the queries that need your attention. Fixing these "heavy" requests is the fastest way to improve your overall user experience.
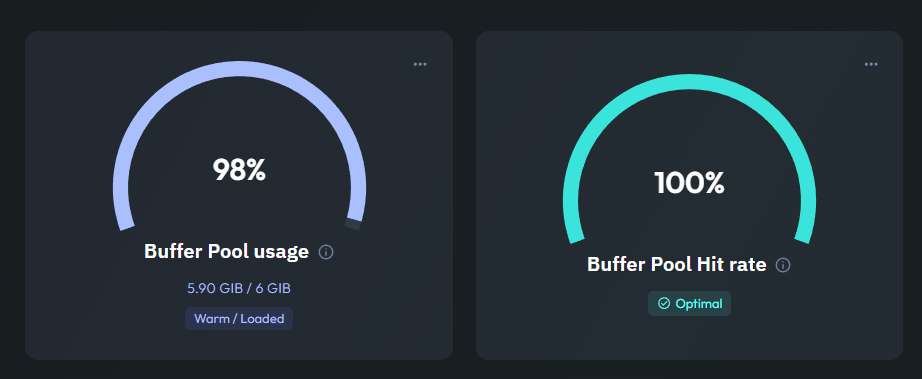
InnoDB Buffer Pool Health
The Buffer Pool is the heart of MySQL performance. These gauges show your Buffer Pool Usage and Hit Rate, indicating how much of your data is being served directly from memory versus slower disk reads.
A high hit rate means your database is perfectly tuned and responsive. Monitoring these metrics helps you decide if you need to allocate more RAM to MySQL to maintain optimal performance as your data grows.