FrankenPHP simple monitoring
Harness the full power of the modern PHP application server. Monitor your threads and workers in real-time to ensure your FrankenPHP setup delivers sub-millisecond responses.
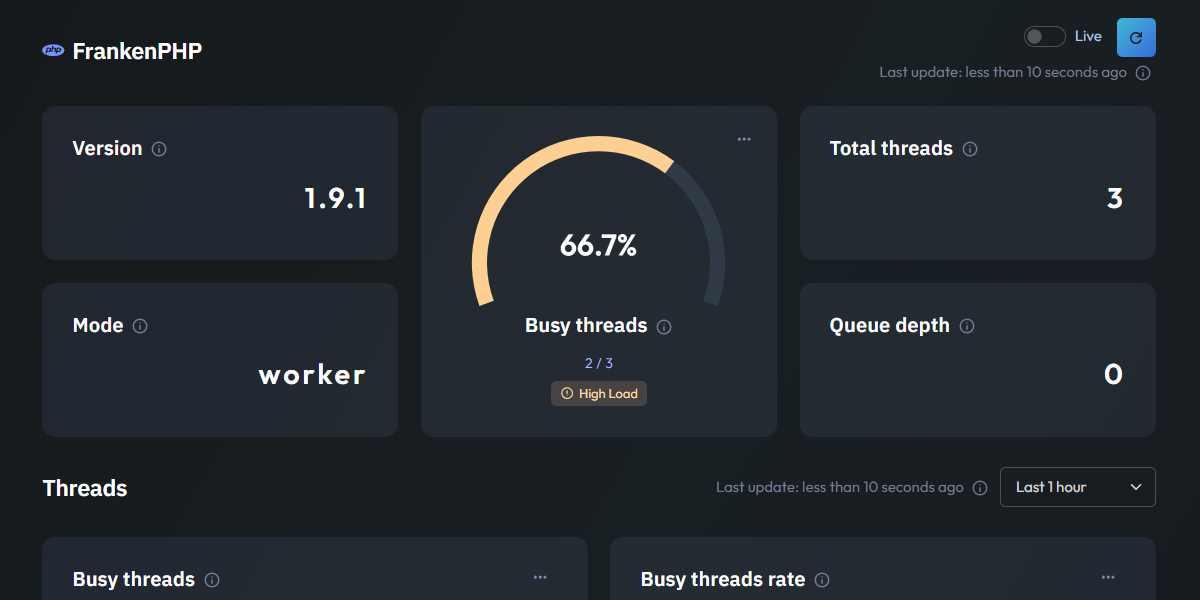
Essential FrankenPHP metrics
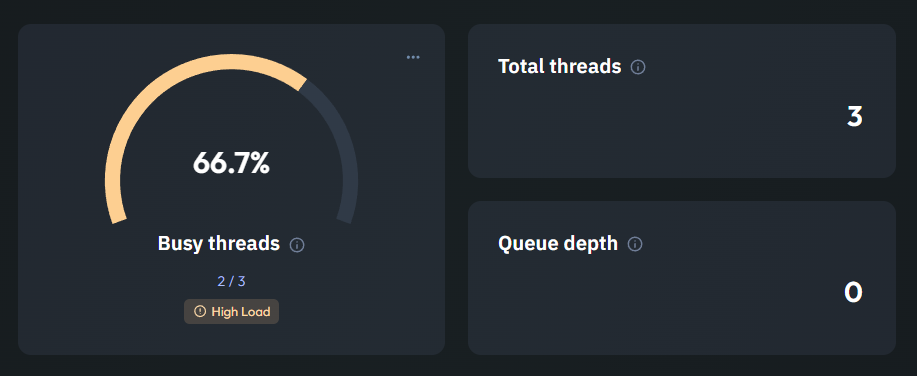
Server Thread Management
This section provides a clear view of FrankenPHP's internal concurrency. The Busy Threads gauge shows how many threads are actively processing requests, while the Total Threads count helps you understand your server's current scale.
Monitoring the Queue Depth is essential for identifying congestion. A rising queue depth indicates that your threads are saturated and requests are waiting to be handled, signaling that it may be time to tune your resource limits.
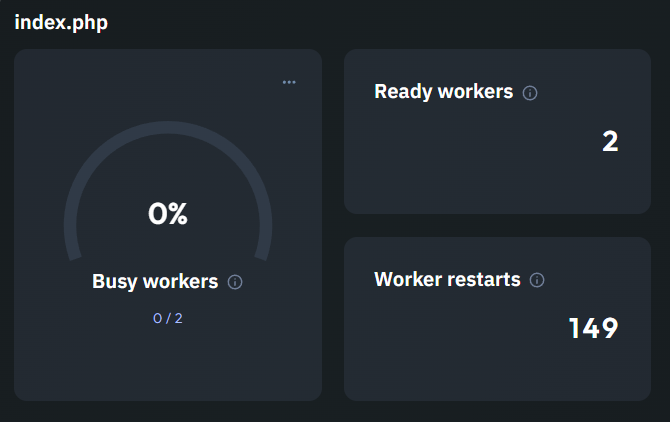
Worker Performance & Stability
When running in Worker Mode, your application stays in memory for maximum speed. This view tracks Busy Workers versus Ready Workers, giving you an immediate sense of your available capacity to handle new incoming requests.
We also monitor Worker Restarts, which is a vital stability indicator. While occasional restarts are normal, a high number could reveal memory leaks or crashes in your application code that need to be addressed to maintain peak performance.
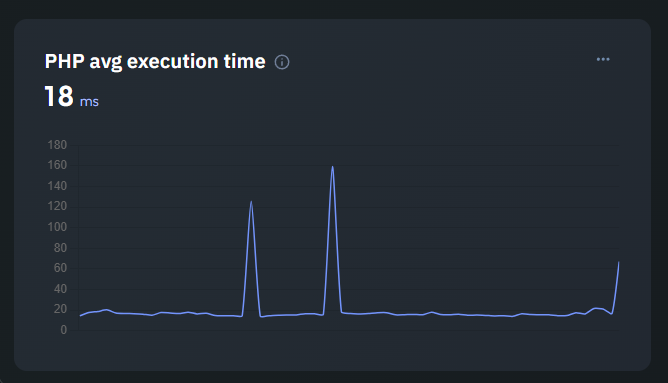
PHP Average Execution Time
Specifically designed for Worker Mode, this line chart tracks the Average Execution Time of your PHP scripts. Because workers eliminate the overhead of booting the framework on every request, you should see ultra-low latency here.
Tracking this metric over time allows you to detect performance regressions immediately. If your execution time starts to creep up, you can quickly investigate which part of your code is slowing down, ensuring your application stays lightning-fast.